Sales Analytics
A desktop application that turns sales records into clear answers: total sales, the best-selling product by quantity, the strongest month, average order value, and the number of orders each month.
Users can import CSV data, map their columns, filter by month, explore product performance, and export monthly summaries. Orders containing multiple products are counted once. The interface supports English and Hebrew.
The screenshots show the English interface before a sales file is loaded. Metrics and charts are populated from your own data. Click a screenshot to view it at full size.
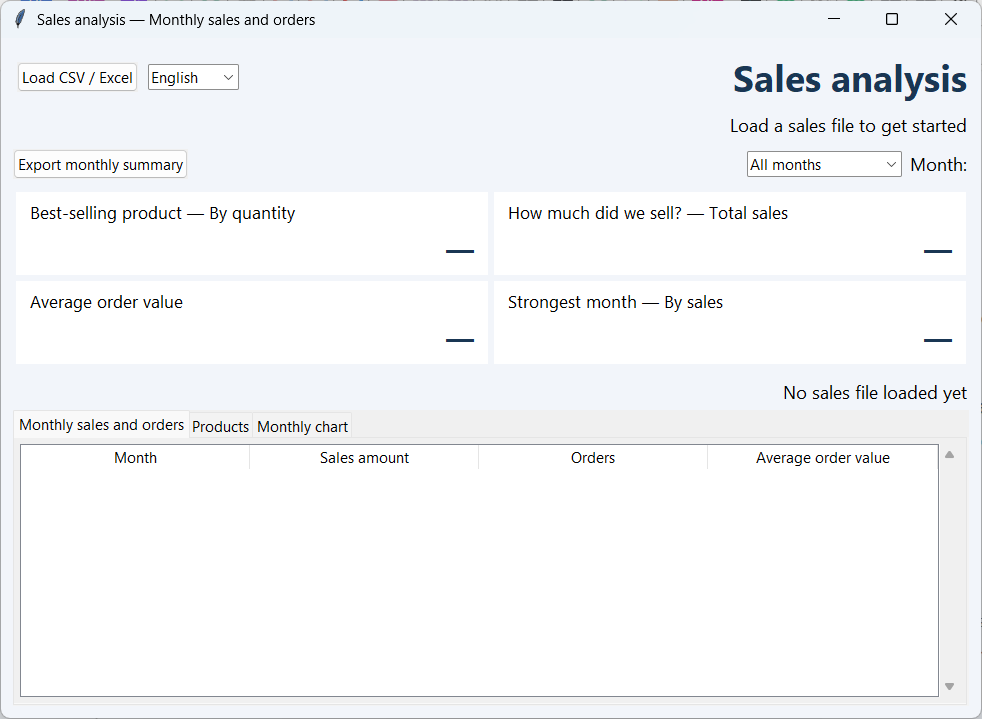
Monthly sales and orders
Review the key metrics and compare revenue, unique orders, and average order value for each month.
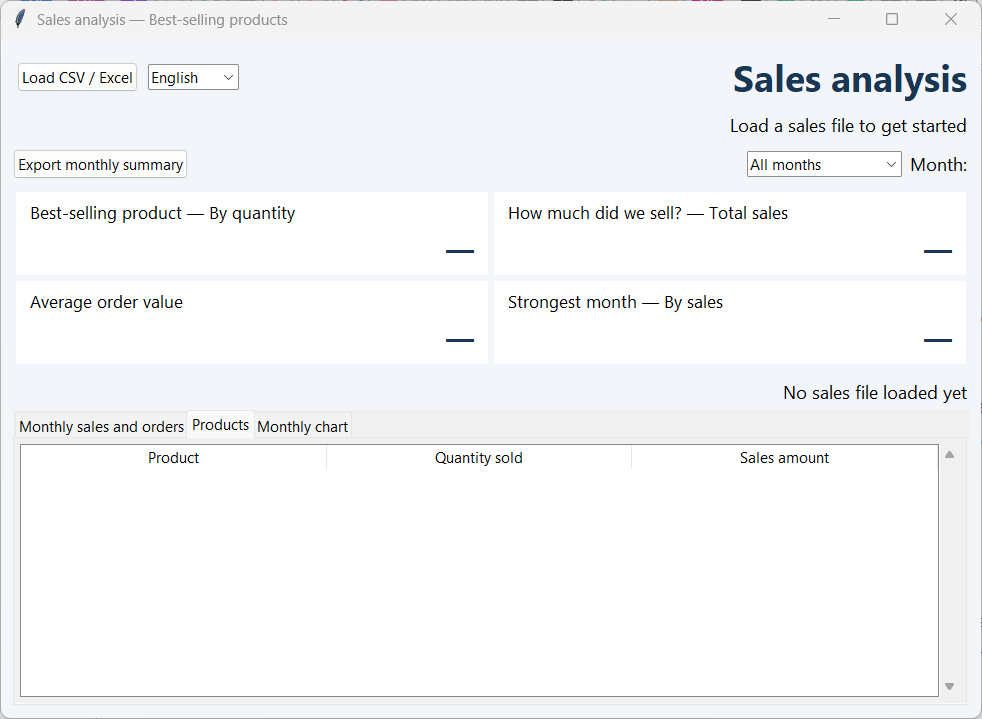
Product performance
Find the best-selling products by quantity and compare their contribution to total sales.
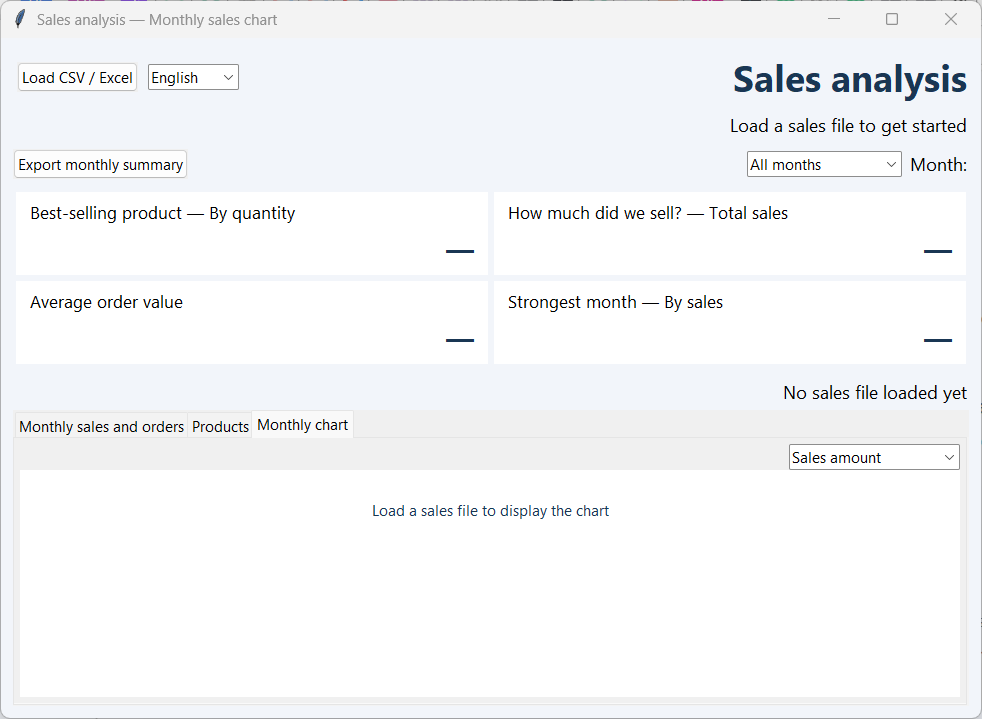
Monthly trends
Compare monthly sales visually and switch the chart to show the number of orders.